Visual Management: The dashboard for everyone
Improve Performance with Visual Management
Visual Management is designed to facilitate the transmission of information between a large number of people at all levels. It facilitates the achievement of daily improvement and constantly offers the different messages and indicators necessary for various objectives.
DOWNLOAD THE VISUAL MANAGEMENT MANUAL
Visual Management: The Dashboard For Everyone
A true LEAN tool, Visual Management (view-based management and organization) is based on a set of communication techniques. This method is designed to facilitate the transmission of information and objectives between people at all levels, to detect problems as quickly as possible, and to make necessary decisions. These techniques must be simple to implement and be accessible to the field and in real time. A board must be visualized in a few seconds and also comprehensible to everyone.
To facilitate reading, means of transmitting information are used: signs, symbols, graphics, colours or pictograms. The texts, when used, are concise and reinforce the main information conveyed by the visual message. During a training session, we remember:
-
10% of what we read
-
20% of what we hear
-
30% of what we see
-
70% of what we share
-
80% of what we experience on our own
-
95% of what we teach others
Act On Visual Management
Visual Management functioning is based on simple tools: a panel or whiteboard, clear and useful indicators, meetings organized by the manager. To ensure effective communication, it is necessary to provide adequate support and visual information. A beautiful empty or misused board has no interest and will soon be forgotten. The board is structured according to 3 levels: titles, results and actions, additional information. The communication support is also divided into sections representing the key performance indicators or the key information needed on a daily basis for the team.
Lean Support Tool: Visual Management
Visual Management is a tool used for by all Toyota Production Systems (TPM) employees. It is therefore a fundamental support for Lean. This visual expression is also associated with the 5S method and ca n fall under the grouping of Kanban, Six Sigma, and PDCA methods. The ultimate purpose of this management is to achieve a Visual Factory.
Visual Management Goal: Communication
Visual Management allows anyone to know about an area of activity (production or service) if the situation is normal or irregular, if problems are identified, if the teams deal with the real problems with the appropriate criteria for their resolution. The aim is to quickly visualize the relevant indicators of a department or workshop in order to be able to manage the different activities efficiently.
Reactivity implies by definition a useful and immediate understanding without delay.This is only possible with key information, which can be stored quickly and easily. Hence the interest of setting up a real management project. Visual Management is therefore a proximity management.
Visual Management can be considered the lever for company performance and thus enable the involvement of everyone by relying on vision, knowledge and action.
- Support tool for ALL progress tools.
- Enables the involvement of all actors.
Advantages of Visual Management
- Facilitates access to information and understanding of messages by as many people as possible
- Immediately identifies gaps between the ideal and real situation
- Visualizes processes, risks
- Identifies opportunities for improvement
- Unifies teams by sharing information
- Reassures clients and other stakeholders
- Encourages employee involvement in the development and daily use of Visual Management
Visual Management Examples
-
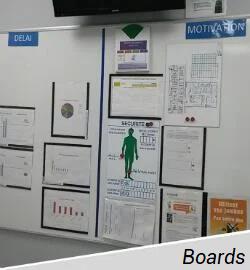
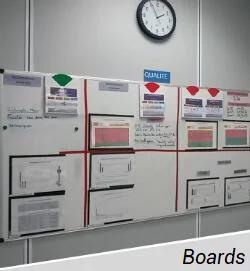
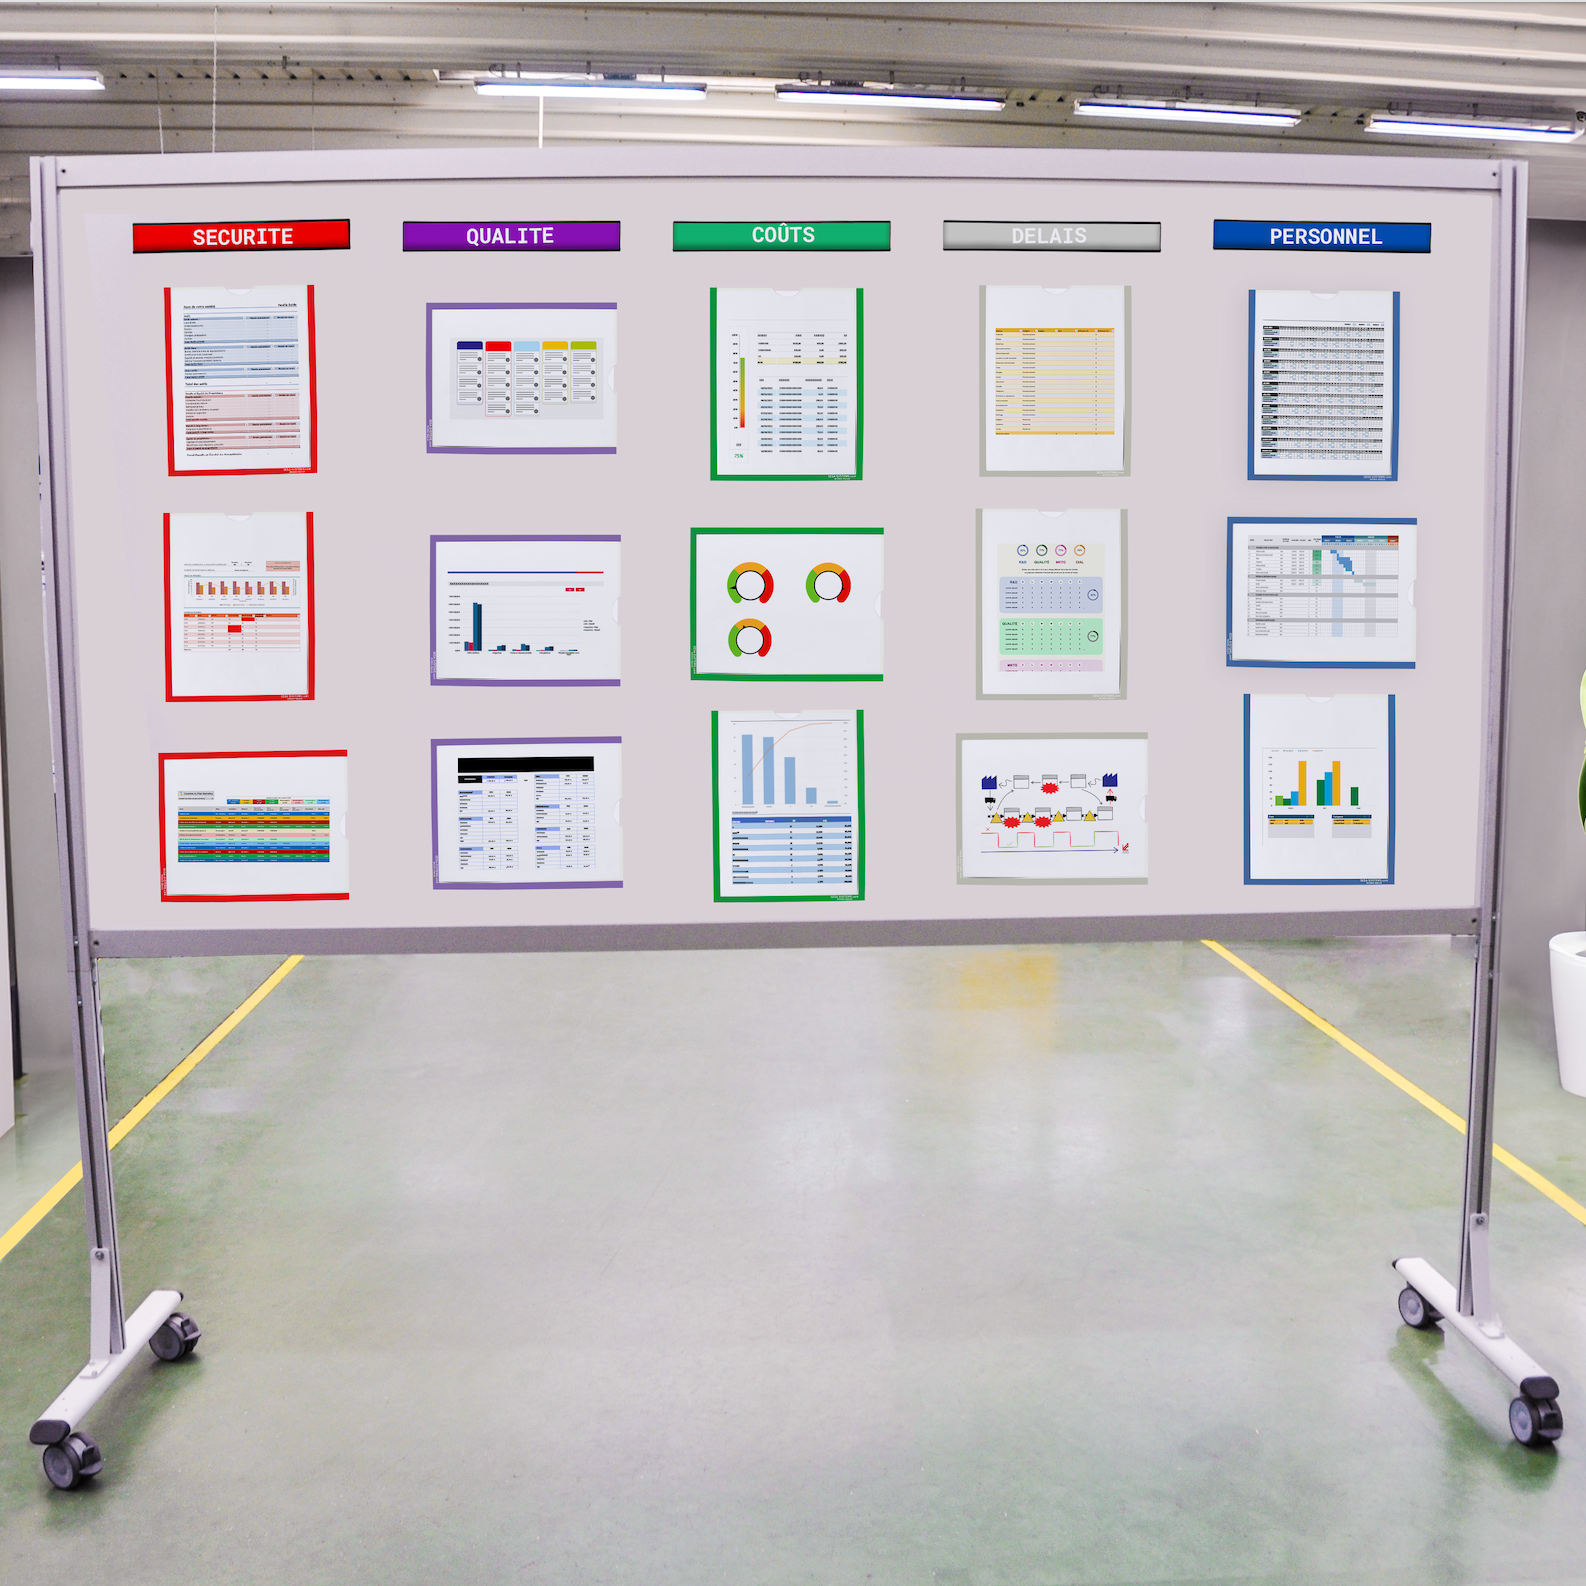
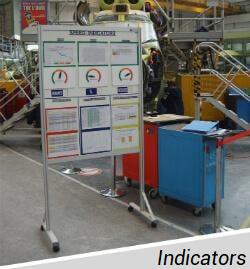
Visual communication support
Communication supports and display boards provide real-time visibility and allow you to :
- Facilitate the implementation of visual communication in an industrial environment
- Present the company's performance indicators and procedures
- Encourage the participation of all stakeholders for a better overall performance
-
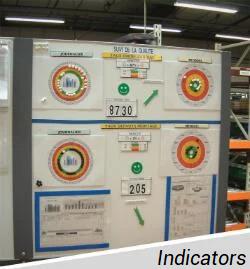
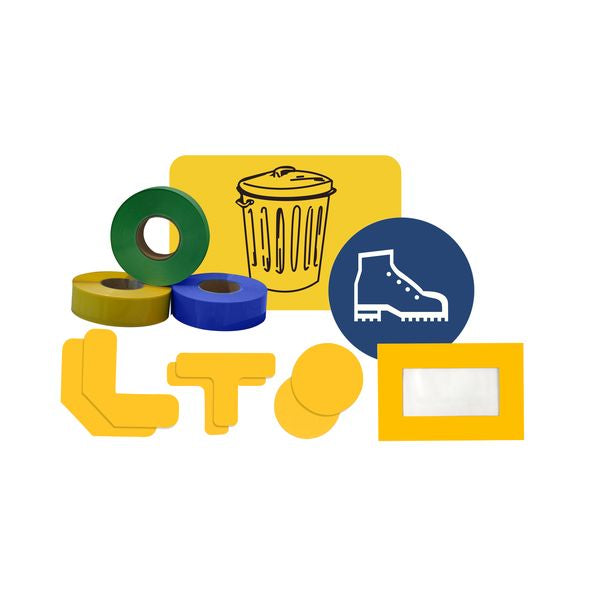
Visual and Magnetic Indicators
Indicators are essential tools for a quick reading of information. Making it possible for information that is :
- Understood by all
- Accurate and Efficient
- Reactionary to drift but also be able to act in anticipation
-
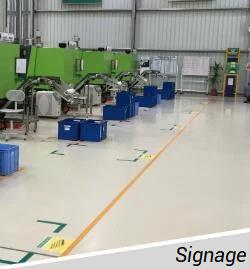
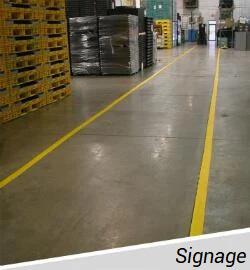
Signage
The signage of a factory, offices, stores, etc. is essential, especially for :
- Inform and report machine performance through indicators
- Orienting and guiding employees
- Encouraging the support of all actors for a better overall performance
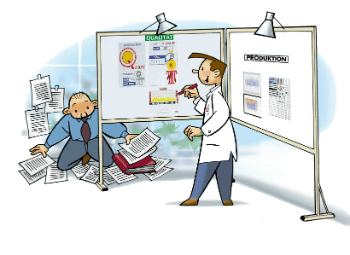
How to Succeed with Visual Management?
"Hey ! So, how'd it go this morning?"
"It's been fine!"
This is not reassuring nor enough information! Everyone must be able to understand what is happening in their area. The "visual management space" must contain a set of useful daily information that can be understood by everyone and, of course, it should be primarily composed of indicators. Indicators offer a simple and effective solution to keep data up-to-date, to visualize progress, to enable relevant decision making and to create a shared vision. There are quality, cost, time, motivation, safety and environmental indicators.
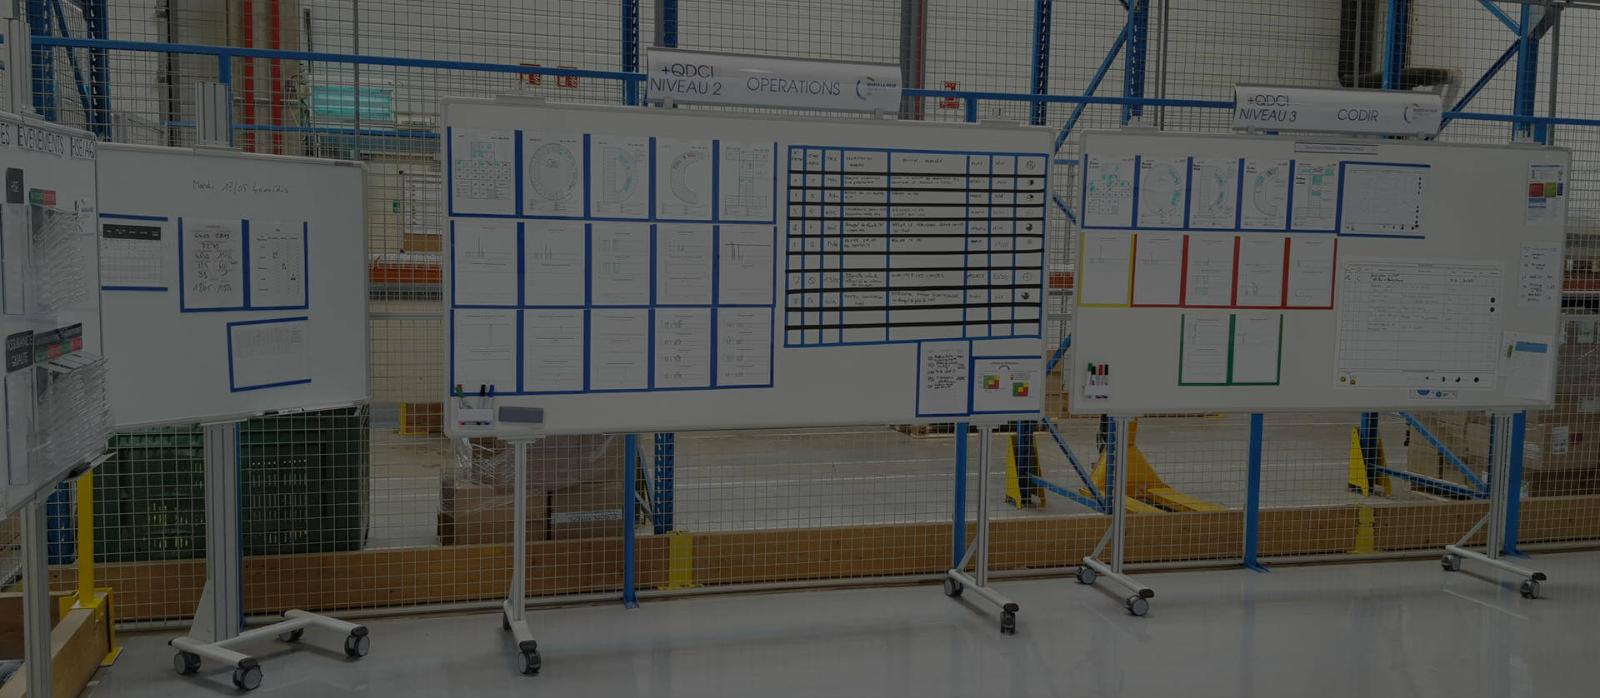
The support of expression must be adapted to each level of communication and each space :
- For operators, communication is achieved through the layout of the workstation with the appropriate documentation, including production or stock management.
- For the unit, a compact table will be more suitable for the assessment of the team and the day.
- For the sector, a large-scale table will summarize the historical results of the different units.
- And finally, for the factory a friendly space will be available to welcome all the teams to take stock of the progress of the projects.
A similar organization can be used for office organization. Visual management can be seen as a lever for the company performance and thus enable everyone to be involved by relying on sight, knowledge and action. Today, thanks to Industry 4.0, it is possible to digitalize visual management.
Visual Management Training Game
Average duration: 2h30
The participants construct a model of a communication point and exchange and argue their choice. Real photos are being studied to identify good and bad practices and target communication areas. Don't wait any longer to train your employees in Visual Management through gameplay.
The Visual Management Starter Kit: Immediate visualization of Q, C, D, M, S, E (Quality, Cost, Delay, Motivation, Safety, Environment) indicators within the PILOTE project following the game.
Results: collective, shared and effective success.
DOWNLOAD THE VISUAL MANAGEMENT MANUAL
Optimize your processes and improve your performance !
Discover all the concrete applications, tools to implement as well as our advice on our areas of expertise.
Need more information?
Do not hesitate to contact us if you would like more information or customized support.
Our experts are at your disposal.