Industrial performance indicators in real time through connected objects
Industrial performance indicators in real time through connected objects
DOWNLOAD THE VISUAL MANAGEMENT MANUAL
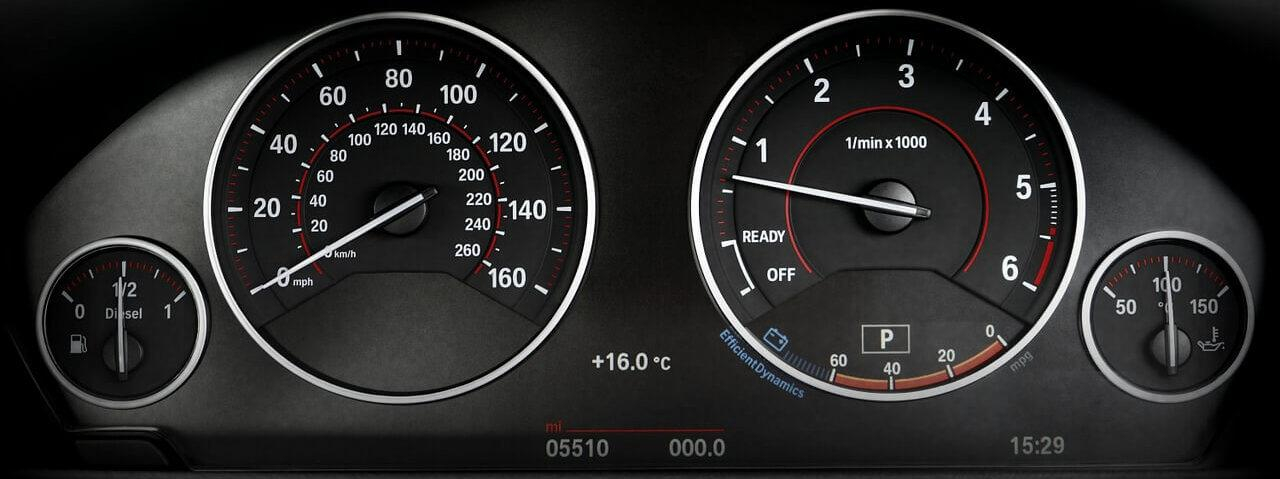
An indicator is objective data that describes a situation from the strict quantitative point of view that shows a result. But the indicator will only have real meaning in the predefined framework if it "indicates" where action is needed. If you take, for example, a dashboard of a car, the oil level indicator is a visual management tool directly connected to the oil pan. Thus a drop in the oil level will be immediately signaled and the indicator light will come on. This is an example of a good indicator since it is directly related to the action area! It provides the user with up-to-date, targeted information that allows them to take action when needed.
Measuring actual performance using industrial indicators
Which measurements you take note of are important. Concerning the use of machines, it is the net production of conforming quality that determines the actual useful output in relation to the theoretical quantity that could have been produced during the opening hours. The use of labor is the total paid time compared to the time allocated which finally expresses real productivity. Frequently, only the time spent at work stations is retained and unproductive time, sometimes far from negligible, is charged to other accounts. However, the remuneration inherent to these unproductive, under-productivity times is well reflected in cost prices.
The consumption of materials and components is the mass of purchases that must be compared to their useful value in the products actually sold. For delays, it is interesting to note from time to time the overall "flow time" of the plant, from the date the main component is picked up to the date the finished product is deposited at the shipping dock. This reference represents the production's real-time. The production unit time is then compared to this reference.
The outcome of measuring these actual performances leads to an exhaustive identification of the extent of the losses between the available resources and their use. These losses constitute the potential for progress, and it is on this impartial basis that animation must be developed through the use of objectives.
These objectives give the measure its full meaning. On the basis of the classification of losses, and for each one, it is necessary to decide on the possibilities of progress achievable in the short to medium term. We therefore objectively quantify the level of results that we wish to achieve thanks to dedicated resources. This means investments in equipment, staff training, the introduction of methodological approaches, organizational changes, and the strengthening of facilitation methods.
It is likely that not all losses can be taken into account simultaneously and it is necessary to draw up a chronology according to 2 possibilities:
- The application of the Pareto analysis, in decreasing order of importance of the results. Pareto allows you to classify the causes of problems in order of importance and thus to visualize the most embarrassing causes. (20% of causes producing 80% of effects). - The resolution of small losses that require little effort and delay, allowing you to reap immediate benefit.
The different causes of non-performance
The presentation of the four axes of progress, Machine, Material, Labor, Flow explains the main approach to improving industrial performance through the application of methodological tools such as HOSHIN, SMED or TPM. The widely confirmed practice shows that the whole satisfies almost all the know-how needs for continuous improvement in production. But in some cases, it doesn't work. We will therefore study why, i.e. the different causes of non-performance.
Causes related to production equipment
The three broad categories listed below classify causes of underutilization and yield losses:
Stops: Equipment is often not used to produce. A distinction is made between the causes of downtime specific to the design and reliability of equipment such as breakdowns, scheduled maintenance, tool changes, and process control.
The causes of stoppages induced by the organization of manufacturing such as lack of material, lack of personnel, testing of new production or techniques, power supply failure, and downstream blockage.
Non-quality: Part of the production is discarded for non-conformity either at the start of a new series requiring adjustment approaches, or during the manufacturing process leading to waste and scrap.
We will seek to optimize the output of production equipment in order to maximize the return on investment and limit the costs associated with its operation to the strict minimum. In concrete terms, beyond the concern to safeguard the equipment's initial new condition throughout its life with the goal of the slightest risk of breakdown, all other sources of stoppages and underperformance, whether organized or random, will be screened in order to minimise their impact on operating time.
Causes of material consumption
In addition to the losses due to non-quality at successive stages of production, all unnecessary consumption linked to the technical nature of the manufacturing process and organizational malfunctions are taken into account from the moment the product enters the factory until it is shipped:
Material management: This management is located between storage and use locations and generally results in inventory discrepancies whose origin is rarely known. These are quantities received that are not in conformity, of degraded quality but accepted due to the impossibility of a rapid replenishment, degradations generated by storage conditions and means of handling, misplacements here or there, and finally obsolete quantities.
The technique: These are losses related to choices depending on purchasing criteria or the nature of the manufacturing process: cuttings, chips, evaporations allowed in consumption standards but insufficiently questioned.
Processing: This primarily involves waste and scrap from start-up or during manufacturing, but also waste littering the floors or left on the bottom of containers, damage committed during handling at substations and handling interposts, quantities in excess of needs not reintegrated into the store.
Discover our products for tracking your indicators
Time losses are grouped into four categories as mentioned below:
Social: The first is absenteeism, all causes included. But also time devoted to recognized activities: information, meetings or training.
Occupation: The personnel is on station but a malfunction prevents them from producing: waiting for supply, untimely interruption of the flow, absence of instructions, waiting for a tool change or troubleshooting, poor line balancing, and over-staffing in relation to the load.
Efficiency: The staff is busy but their performance is far from the objective: inadequate skills, dubious motivation, slow gestures, disrespect of operating modes, trying or abnormal working conditions, non-quality, and rework.
Methodology: It is the potential gains, and therefore induced losses, that require a critical review of operating methods and workstation layouts. Indeed, the creation of a job is in principle the situation optimized the day it was designed. There is no evidence that the best organizational conditions were met on that day.
These will help to organize time savings and optimize time use. While knowing that the objective will be the rationalization of manufacturing methods and means, but more widely the most efficient use of all paid hours, whether direct or indirect labor.
Causes related to flow management and delays
Just-in-time is the slogan of the factory without stock but able to guarantee the promised delivery time. The losses of time or delay encountered are represented in the form of three categories:
Expectations : Translated by stocks and work-in-progress, it is the comfort that successive links in the manufacturing process grant each other in order to cope with malfunctions and insufficient flexibility: high rate of equipment unavailability, unsuitability of capacity to the load, insufficient versatility of personnel, late anticipation of supplies, and change of unorganized tools.
Lot size: The larger the size of production orders and containers, the longer the residence time at each stage of the manufacturing process. The ideal in terms of lead time is the piece-to-item flow from item to item.
Non-reliability: This category essentially concerns the multitude of micro-stops in the operation of equipment, the non-conformity of supplies, the difficulty of controlling quality, retouching and rework, which resutls in delays of flow.
Based on the adapted conditions of the production tool's flexibility, the approach will aim to shorten as much as possible the crossing time of the plant (flow time), from the handling of materials and components to the provision of finished products.
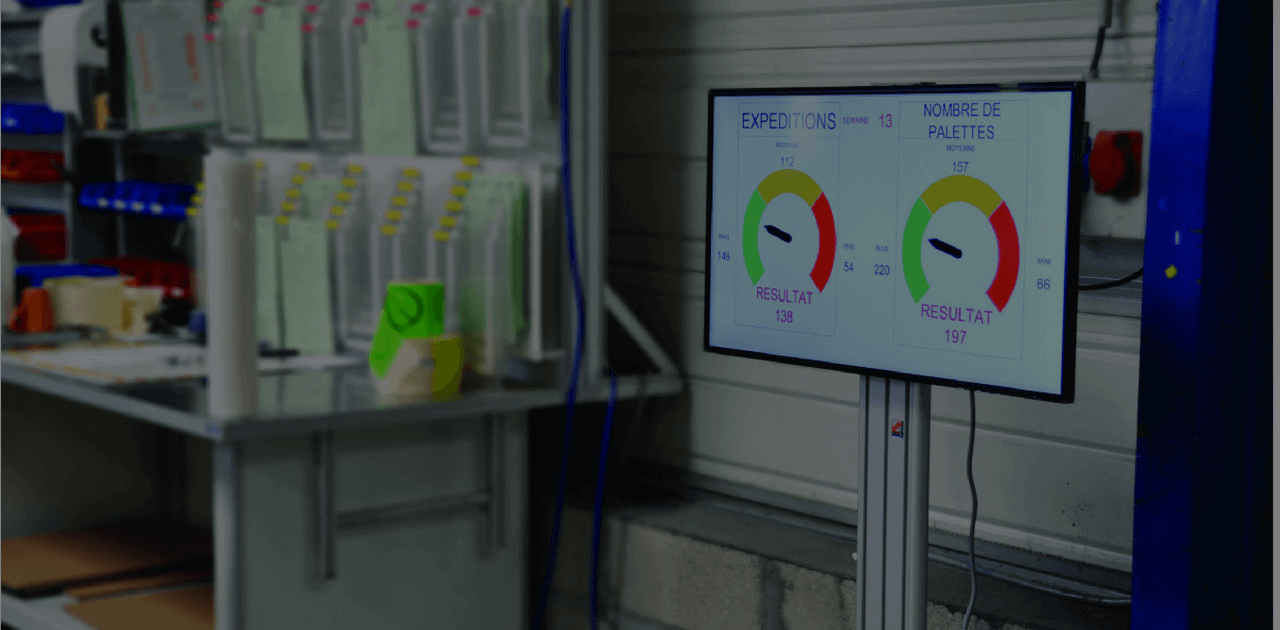
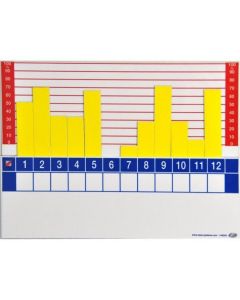
Tools for displaying industrial performance indicators
Discover SESA SYSTEMS creations to display performance indicators in real time.