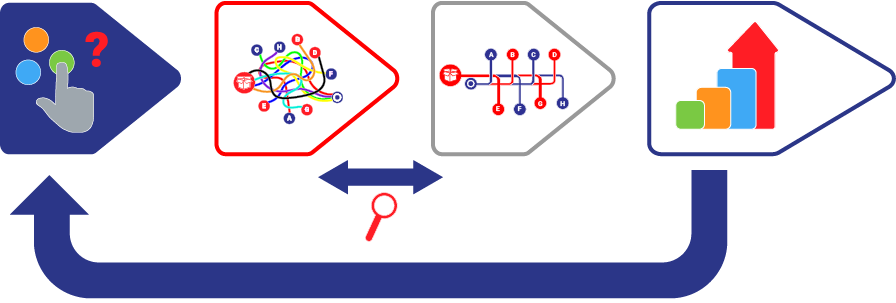
Visualize and map all the flows and value chains of your processes with VSM
Visualize and map all the flows and value chains of your processes with VSM
VSM is a tool to map all the flows and value chains of your processes
DOWNLOAD THE VSM MANUAL
What is VSM?
VSM (Value Stream Mapping) is also called Cartographie de la chaîne de valeur (CCV) in French or Materials and information flow mapping (Toyota). It is a LEAN tool used to analyze all the stages of realization of a product or service until its availability for the end customer. MsM is a visual representation in the form of an organization chart of a production process that highlights the scrolling time of the chosen product. A value chain map uses a common repository of symbols or pictograms to represent: procurement, process, information flows and more. The ultimate goal of the system is to create a unit flow, without interruption and at the pace of the customer's request.
Why is VSM a fundamental tool in a LEAN approach?
A flow travels through successive tasks from a starting point to its end point (flow of information and physical flow of matter). VSM makes it possible to identify all the stages of the process and thus to highlight value-added tasks and to identify the different types of waste such as stocks and in progress.
The VSM method is deployed and is based on 3 distinct phases:
MAPPING THE EXISTING : establish a VSM of the current state of the process. For this, you need to identify, collect reliable information related to the various stages in the field.
DEFINE A FUTURE STATE : project towards an optimized process after identifying opportunities for improvement and thus build the target flow through the development of a VSD (Value Stream Design). The goal is to eliminate tasks and information flows that have no added value (represents activities requiring time, resources, space that do not bring anything to the product / service, they are sources of waste).
BUILD AN ACTION PLAN : The gap between the current VSM and the VSD will make it possible to define a roadmap listing all the actions to be taken to move from the current state to the future state.
How to set up a VSM?
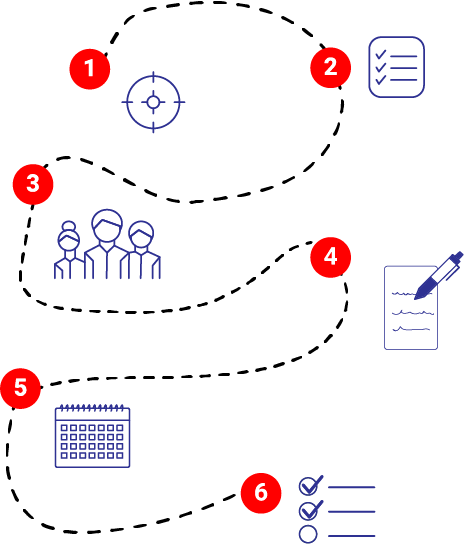
The overall process:
Choose a product family
In order not to overload your VSM which would become unreadable, it is advisable to choose a product family to study and improve with important flows before embarking on the mapping of the process. It is preferable to map a product family, the interest being to conduct a value chain optimization analysis as exhaustive as possible.
Map current flows
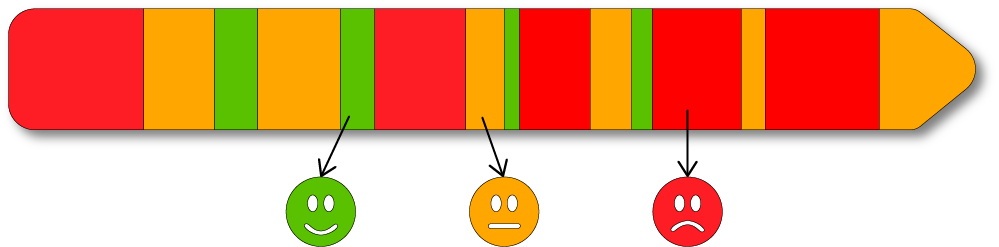
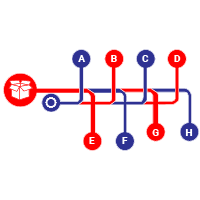
First, to map current flows, you must, equipped with a stopwatch, collect all the information necessary to create your tool in the field: measure stocks, time manufacturing steps, identify waste, identify information flows and physical flows. To do this, observe the process starting with customer delivery and go back up, always keeping in mind the notion of "customer satisfaction". In a second step, sketch a first VSM by hand, with a pencil and on a single sheet, precisely formalizing the physical flows AND the flows of information and their interactions thanks to the symbols. The purpose of this work is to analyze the various dysfunctions: bottlenecks, the most expensive, the heaviest processes (in terms of multiplicity of stakeholders) or the most sophisticated and thus avoid the dispersion of efforts. VSM also allows you to measure lead time, which is the minimum time needed to respond to your customers. The time scale will make it possible to highlight value-added and non-value-added times and thus calculate a flow tension ratio. In the industry, the Total Time to Value Added / Total Crossing Time ratio is frequently less than 1%.
Map future flows (vision)
To imagine the map of future flows (vision), it is recommended to rely on a list of questions according to 4 major axes:
Determine the production rate according to the customer's request (Takt Time),
Organize a continuous production flow (piece by piece),
Otherwise, establish a drawn flow,
Smooth production in order to optimize work-in-progress.
The answers to these 4 main questions associated with possible improvements will make it possible to model the map of the future state and / or the ideal state that indicates objectives for the elements leading to a more efficient process.
Carry out improvement actions to obtain the vision
The gap between the current MSM and the future MSM will materialize in the form of an action plan that will serve as a basis for adjusting according to needs.
What is the purpose of VSM?
VSM is a powerful method that reveals malfunction and waste disposal in any process, not just manufacturing. It is used to list all potential improvements in a process and thus focus efforts on added value from the customer's point of view. As part of the range of LEAN Management tools, value chain mapping contributes to improving the operational excellence of the organization to become more competitive in a society that has become increasingly complex with the objective of mass production. By identifying priority areas for improvement with the process overview, you can more easily identify the sources of added value to be optimized. While the goal of MSM is to eliminate waste, it is also a great tool for communication, collaboration, and even culture change. Decision-makers can clearly see the current state of a process and sources of waste, such as problems: delays in the process, excessive downtime, constraints and inventory problems. The VSM participates in the definition of "your North!", of your strategy. From a "target" vision or mapping, the tool allows you to implement a continuous improvement strategy. However, this Lean methodology requires a substantial investment in terms of staff and time. It is better to start small because MSM requires trained employees and can be conducted over days, weeks and even months.
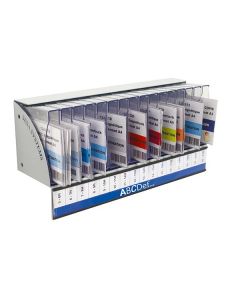
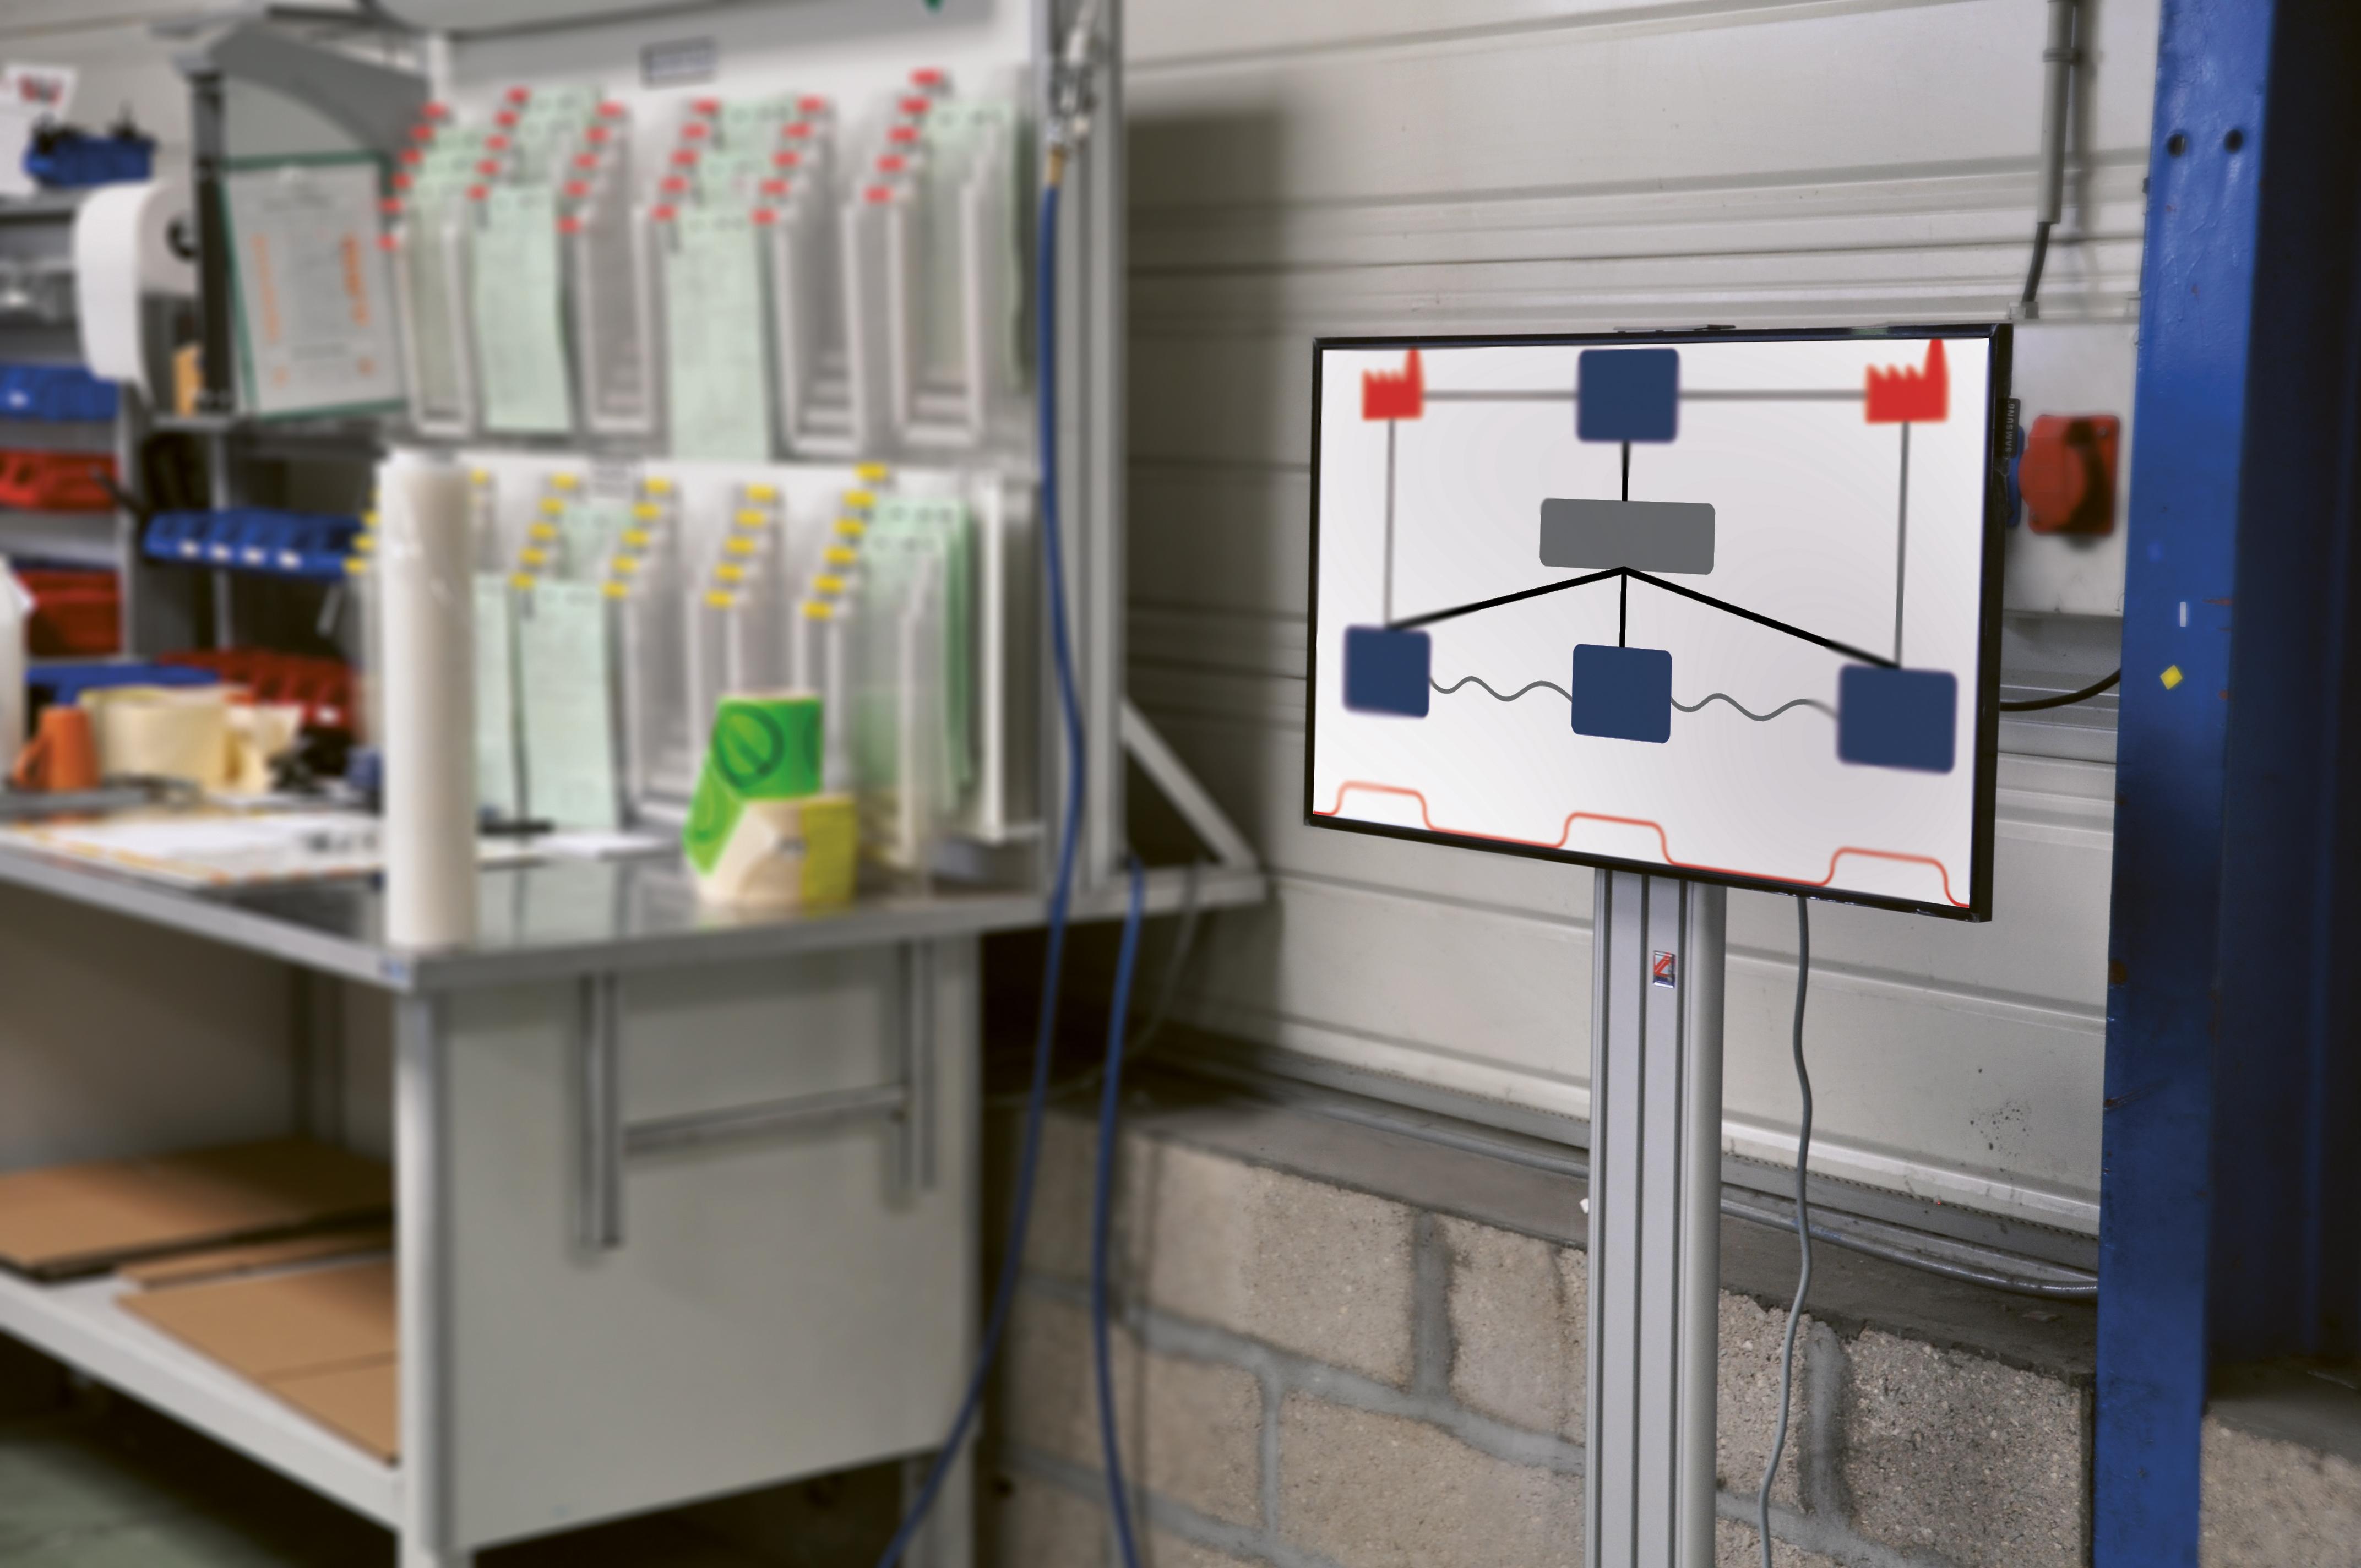
Use the VSM kit to make it easier to build your flow mapping
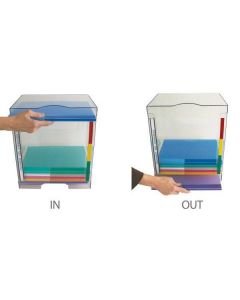
This kit will allow the rapid and structured implementation of the different flows within a production (material and information). Magnetic elements allow the identification of different types of waste such as stocks and in-progress.
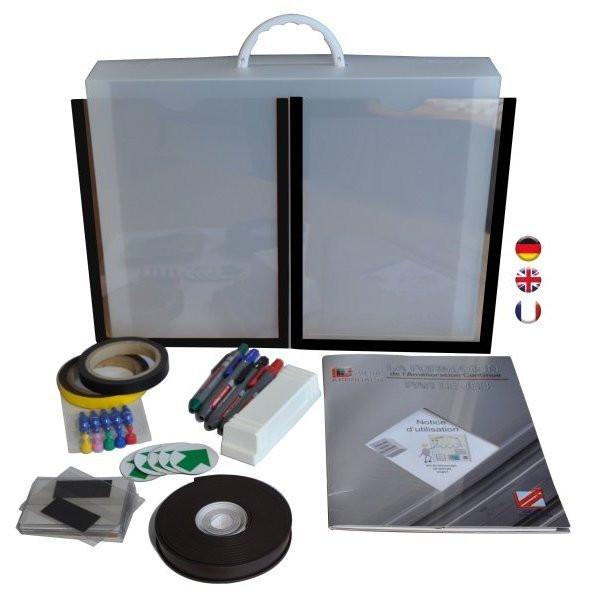
The VSM case contains:
1 INSTRUCTIONS FOR USE for the implementation of a PILOT site
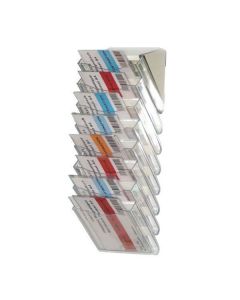
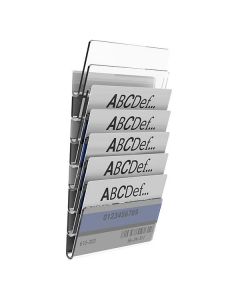
1 Kit of 10 transparent UNIVERSAL CARDS with magnetic fixation (ref. 130243)
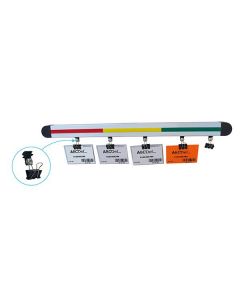
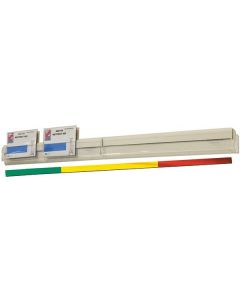
1 Kit of 5 magnetic green arrows (ref. 145025)
1 roll of black magnetic tape (ref. 140704)
1 roll magnetic label L 5 m x H 15 mm (ref. 140715)
1 roll of yellow magnetic tape (ref. 140702)
1 Kit of 30 multi-color magnetic pads (ref. 145010)
1 PRODOC A4 magnetic black (ref. 124310)
1 PRODOC WRITER A4 magnetic black (ref. 124340)
1 Magnetic brush (ref. 143220)
1 SESA'PRINT software (ref. 130815)
1 Pouch of 4 markers (ref. 143211)
The purpose of this VSM kit is to obtain a simple and clear vision of a process with a representation of the lead time of the chosen product. The analysis will then lead to improvements that will focus on the entire process.
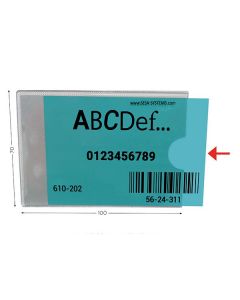
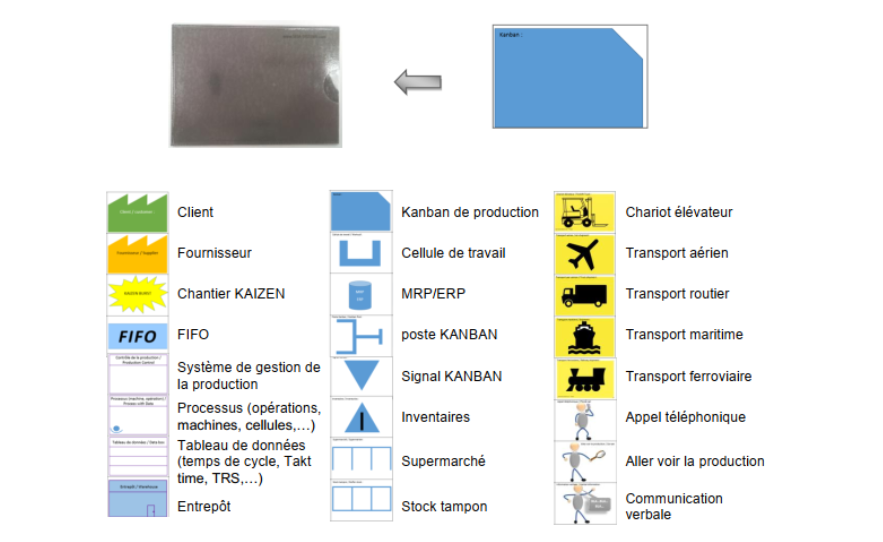
All this data is gathered in a visual representation (CURRENT STATE MAP) using symbols. These symbols are sized (64 x 94 mm) to be cut and then inserted directly into the magnetic KANBAN cards..
Physical information flows will be represented by yellow magnetic stripes, electronic information flows by black magnetic stripes, pushed or product flows by magnetic arrows..
Lead Time will be written on 15 mm height label strips Colored
magnetic studs complete this material and multicolored. They will allow you to materialize, for example, operators, operations without added value, transfers, defects, etc ... You have the possibility to complete the graphic representation with information written by means of the the kit of 4 whiteboard markers provided that your support is provided for this purpose (enamelled surface).


 Choose a product family
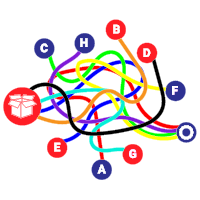 Map current flows
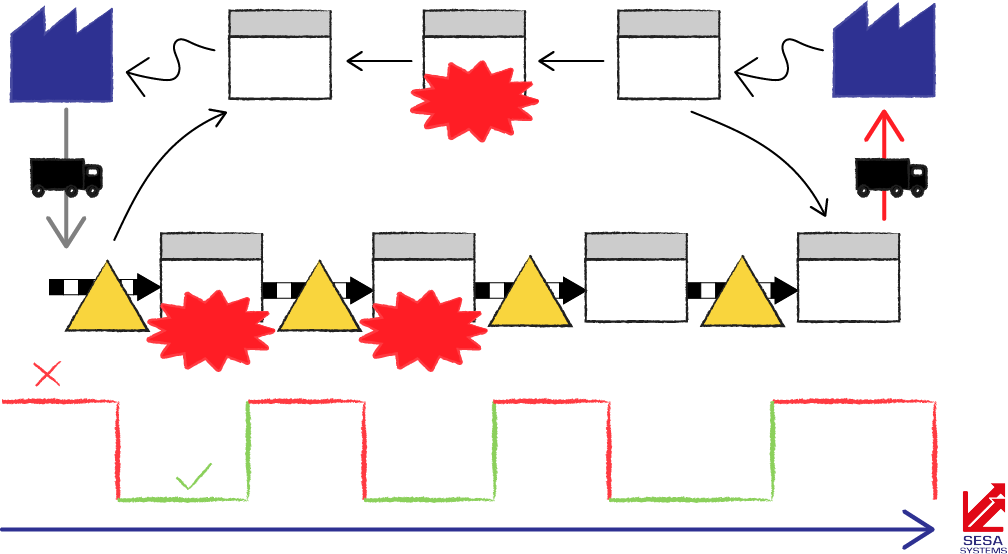
 Map future flows (vision)
 Carry out improvement actions to obtain the vision