The KPI Dashboard
The KPI Dashboard
A KPI dashboard is a tool for monitoring the activities and general health of a company. KPIs, Key Performance Indicator(s), can be applied to almost every aspect of a company (shop floor, sales, finance, organisation, etc.). The indicators that a company can use for each department are extremely abundant, but they all have the particularity of corresponding to quantitative data. It is therefore a question of choosing the KPIs that a company wishes to use. This gives access to unbiased and relevant information on the company's performance at a given time. Each indicator has a precise meaning, which makes it possible to identify the sources of difficulty or the strong points of a company extremely quickly. By adopting the use of KPI dashboards, you will be guaranteed to achieve major improvements in all areas of your business. This will result in dramatically improved processes, better identification of problems, all of which will have a positive impact on your turnover, the effectiveness of your internal policies and your business strategy.
DOWNLOAD THE VISUAL MANAGEMENT MANUAL

A few words about dashboards and KPIs
There are several types of dashboards, depending on whether you have a short, medium or long term goal.
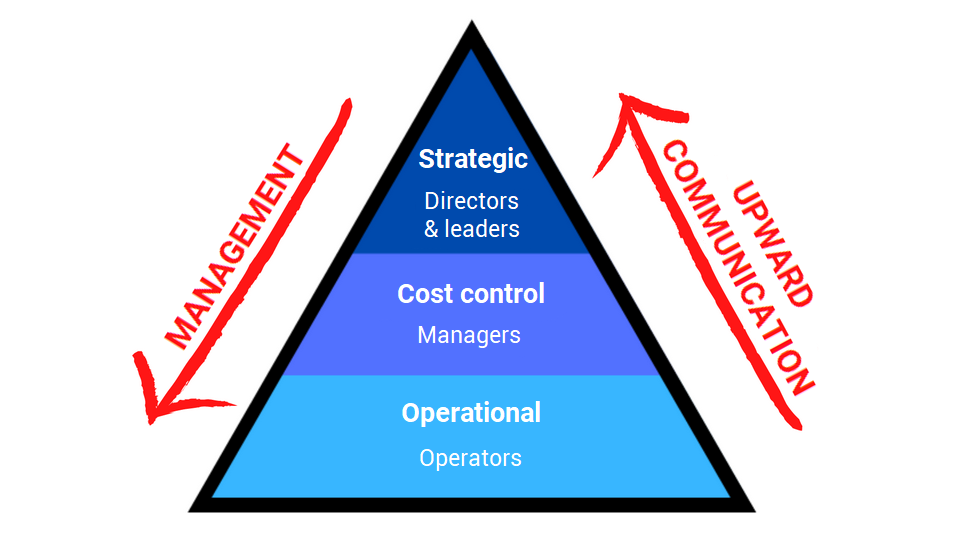
Short term - Operational dashboard
It is a way of measuring processes and performance in real time within a company. This dashboard offers the possibility of having an overall view of the performance objectives set and whether or not they are being achieved. The KPIs in this dashboard can therefore be used to solve problems related to internal difficulties very quickly. This operational dashboard is the most used because it is the most useful for the different teams in a company on a daily basis.
Medium/long term - Cost control dashboard
Also called management dashboard, this dashboard allows to highlight the differences between the forecasts and the reality. It must be able to analyze the causes of these differences and to be able to provide solutions to be implemented in order to mitigate these differences. The cost control dashboard therefore has an objective more focused on the financial aspect of companies.
Long term - Strategic dashboard
The aim here is to provide an overall view of the company's results over a relatively long period. This dashboard is a summary of all the results obtained to facilitate decision-making by the company's managers. It can be consulted on a regular basis as well as on an occasional basis, but what is certain is that it is an essential tool to have at strategic steering meetings.
How to choose your KPIs?
In addition to choosing the type of dashboard you want to set up, you also need to choose your indicators carefully. There is no exhaustive list or list of ideal indicators to include in the dashboard. The company must think about its project beforehand to define its objectives. Once these have been clearly defined, it can choose the type of dashboard and the KPIs to include. There are dozens of KPIs in each field, whereas a dashboard should not display more than a few. It is therefore necessary to be meticulous in the choice of indicators. The latter must necessarily include relevant data, and the wrong choice of indicators can be very prejudicial because poorly selected KPIs can obscure indicators that would be more relevant, for example. Once the data has been collected, it can be analysed to extract relevant information for decision-making.
We encourage you to apply some generic advice when choosing your indicators. They should be:
- Reliable: This can only be done based on properly collected quantitative data. A KPI is, after all, a metric record.
- Simple and clear: The indicator should be understandable to as many people as possible. Important data should be identifiable immediately.
- Non-manipulable: The indicator must be factual, i.e., it must correspond to a reality that can be evaluated with quantitative tools.
- Progressive and evolving: The KPI cannot be fixed in time, it must progress. Otherwise, it means that it has been badly chosen or that the company is experiencing difficulties.
- Relevant: A good indicator is a well-chosen indicator. The purpose of a dashboard is to help achieve objectives and to forecast. An indicator should therefore make a significant contribution to the forecasts that a company makes. As soon as a problem is identified, the company must take remedial action.
In concrete terms, which KPIs can be found in a dashboard?
A few examples:
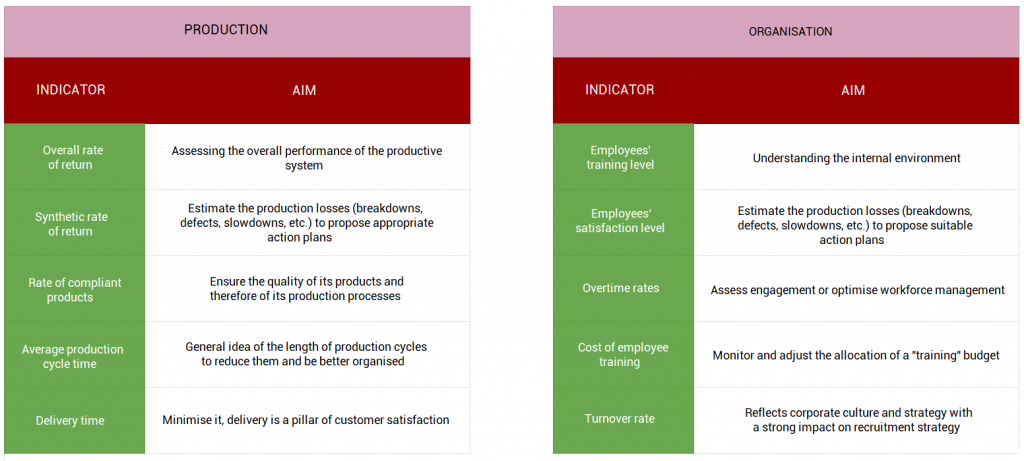
This is a very short list of indicators. We can consider that there are between twenty and thirty depending on the field/service in which a company is established.
How to build a dashboard?
It is not enough to have the "right indicators" to succeed in implementing an effective dashboard. It is a tool with a very strong collaborative aim, which is why it is advisable for a company to consider the following steps:
Define the objectives.
This is the starting point mentioned earlier. It is crucial to determine the aim of this dashboard beforehand. Is it for short or medium/long term monitoring? A choice must be made between an operational, cost control or strategic dashboard. This choice must be made in accordance with the objectives of the team or the company. To succeed at this stage, it is essential to ensure communication internally. This will determine the indicators that will appear on the dashboard, the way they will be presented and their evolution.
Choose your indicators.
If the goals are precisely set, then the choice of indicators becomes relatively simple. In general, KPIs respond in a very concrete way to issues and go to the heart of the matter. For example, one indicator may be dedicated to the number of stops in a supply chain, another may be dedicated to gross revenues.
Create your dashboard.
Once the structure is in place, the dashboard must be built. This step involves choosing a tool or platform. This may be software or websites offering this service. In any case, the dashboard must be based on a few essential features:
- A database. Dashboards need a database to store information.
- Collaborative feature. Employees must be able to access the dashboard to review it and possibly contribute to it.
- A report module to be able to compile and process the collected data. This can be done through statistics, graphs, etc.
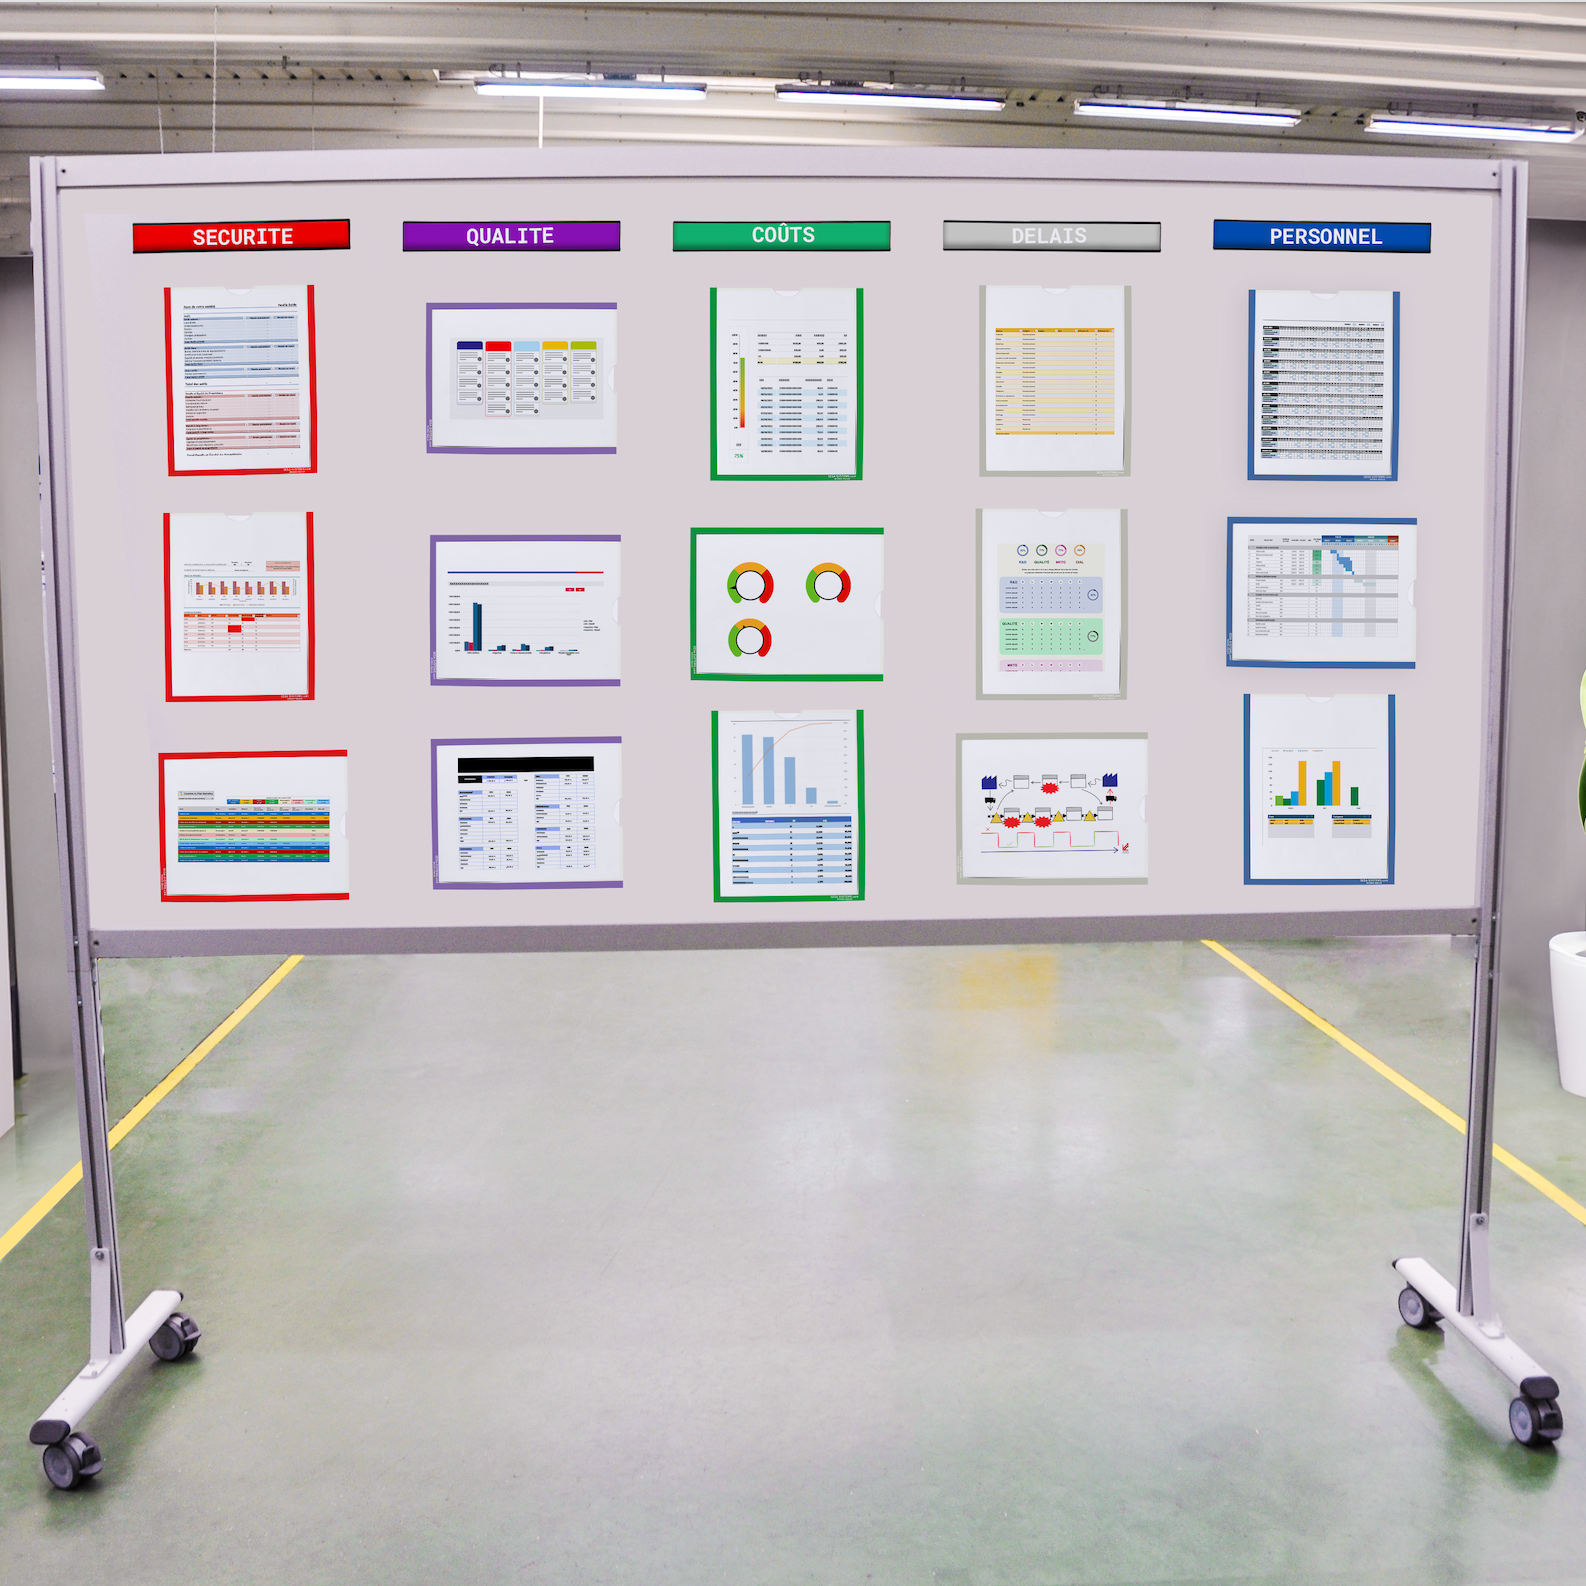
Prepare the presentation of your dashboard.
Now that the outline of the dashboard has been established (goals, indicators, platform), it is time to think about its structure. This requires the indicators to be formatted and prioritised. Often, companies prefer indicators to be displayed in the form of "graphs" and with colours. This particularly visual way of working makes it possible to see changes and to see how the company (or department) is doing in relation to past results or goals. As we are particularly experienced in visual management, we invite you to read our articles on the subject.
What are the benefits of a dashboard?
The first benefit is the clear improvement in overall performance. The quantitative approach to the company's activities and results allows them to quickly identify and solve bottlenecks. The monitoring offered by a dashboard particularly helps to observe the results on the indicators, results that can often come from the implementation of action plans (especially with the PDCA method). Dashboards allow for effective monitoring of a company's performance, which enables them to be positioned in a continuous improvement process.
KPIs also offer the possibility of accessing important information that a company does not naturally have access to. For example, indicators can reveal the seasonality of a company according to its activities. This is an essential criterion to take into account for the optimal functioning of a company.
On the other hand, dashboards have a very strong collaborative aspect. They allow regular access to results, largely based on the work of employees. This makes it easier for employees to be valued, which thereby leads to a stronger commitment to the company daily. Keeping employees motivated and participating in the valorisation of their work is a process that has an indirect impact on the performance of a company.
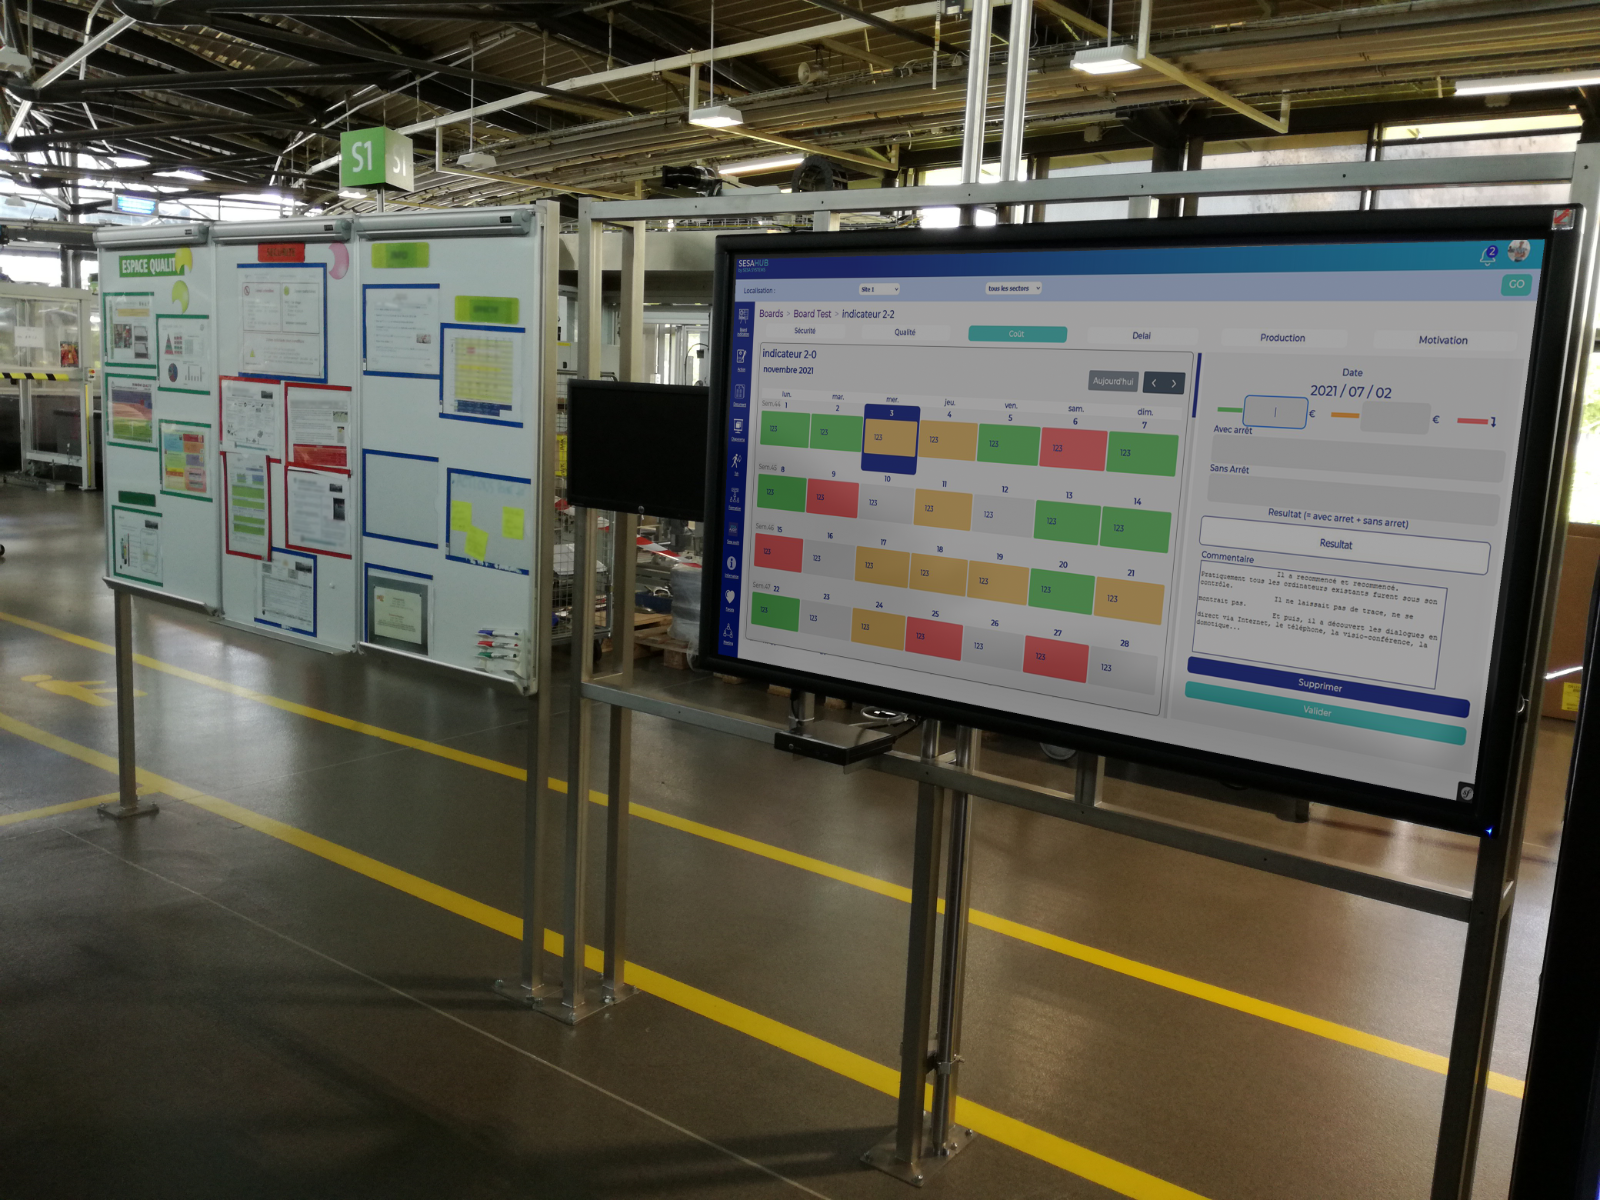
What we can do for you
As pioneers in the practice of Lean Management, we are particularly sensitive to the issues of performance improvement in companies. For this reason, we have developed the SESAHUB interface, which allows you to create optimal dashboards among several features. In the case of SESAHUB, it is a dashboard connected to all the screens in your company. Indeed, SESAHUB works with an SQL server. Consequently, this software is very easy to launch using a web application. Also compatible with smartphones, SESAHUB allows you to collect data that is accessible to your entire company from a database that is updated in real time. This system makes it possible to organise meetings very easily, top 5 (minutes)/15/30 meetings and with different consistency, depending on their importance. Once a meeting is over, you can write a report in a few clicks from the interface, a perfect addition to the use of a dashboard. This tool will enhance the performance and collaboration of your company for several reasons:
- Employees will be given more responsibility because they will be more frequently faced with the company's results, partly due to their investment.
- The whole company will be able to collaborate via SESAHUB.
- Transparency about the company's goals will be increased and commitment will be greater as they participate in the success of common goals or the implementation of a global strategy.
We offer other useful products/services for the development of a dashboard on our dedicated website sesa-systems-digital.com !
DOWNLOAD THE VISUAL MANAGEMENT MANUAL
Optimize your processes and improve your performance !
Discover all the concrete applications, tools to implement as well as our advice on our areas of expertise.
Need more information?
Do not hesitate to contact us if you would like more information or customized support.
Our experts are at your disposal.