Visual Management helps to improve performance.
The goal of a Visual Management project is the relaying of information between people of all hierarchical levels. This method allows for daily improvement because the different messages and indicators are shared and concern all the people in a company.

Visual Management, the dashboard for all.
A true LEAN tool, Visual Management (management and organisation by sight) is based on a set of communication techniques. This method is designed to facilitate the relaying of information and goals between people at all levels, to detect problems as quickly as possible and to take the necessary decisions. These techniques must be simple to implement, accessible on the field and, above all, in real time. A table must be visualised in a few seconds and must be understandable by all. To facilitate reading, information is presented using signs, symbols, graphics, colours, or pictograms. Texts, when used, are concise and reinforce the main information conveyed by the visual message.
Why is Visual Management effective?
- The visualisation of information strengthens communication.
- The frequency of meetings reinforces communication, everyone has access to the same level of information and the updating of indicators is rapid.
- It allows for quicker problem solving, which encourages employee motivation.
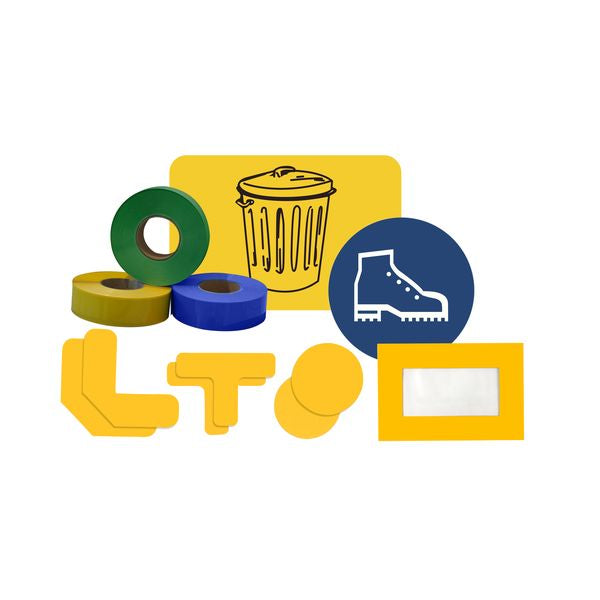
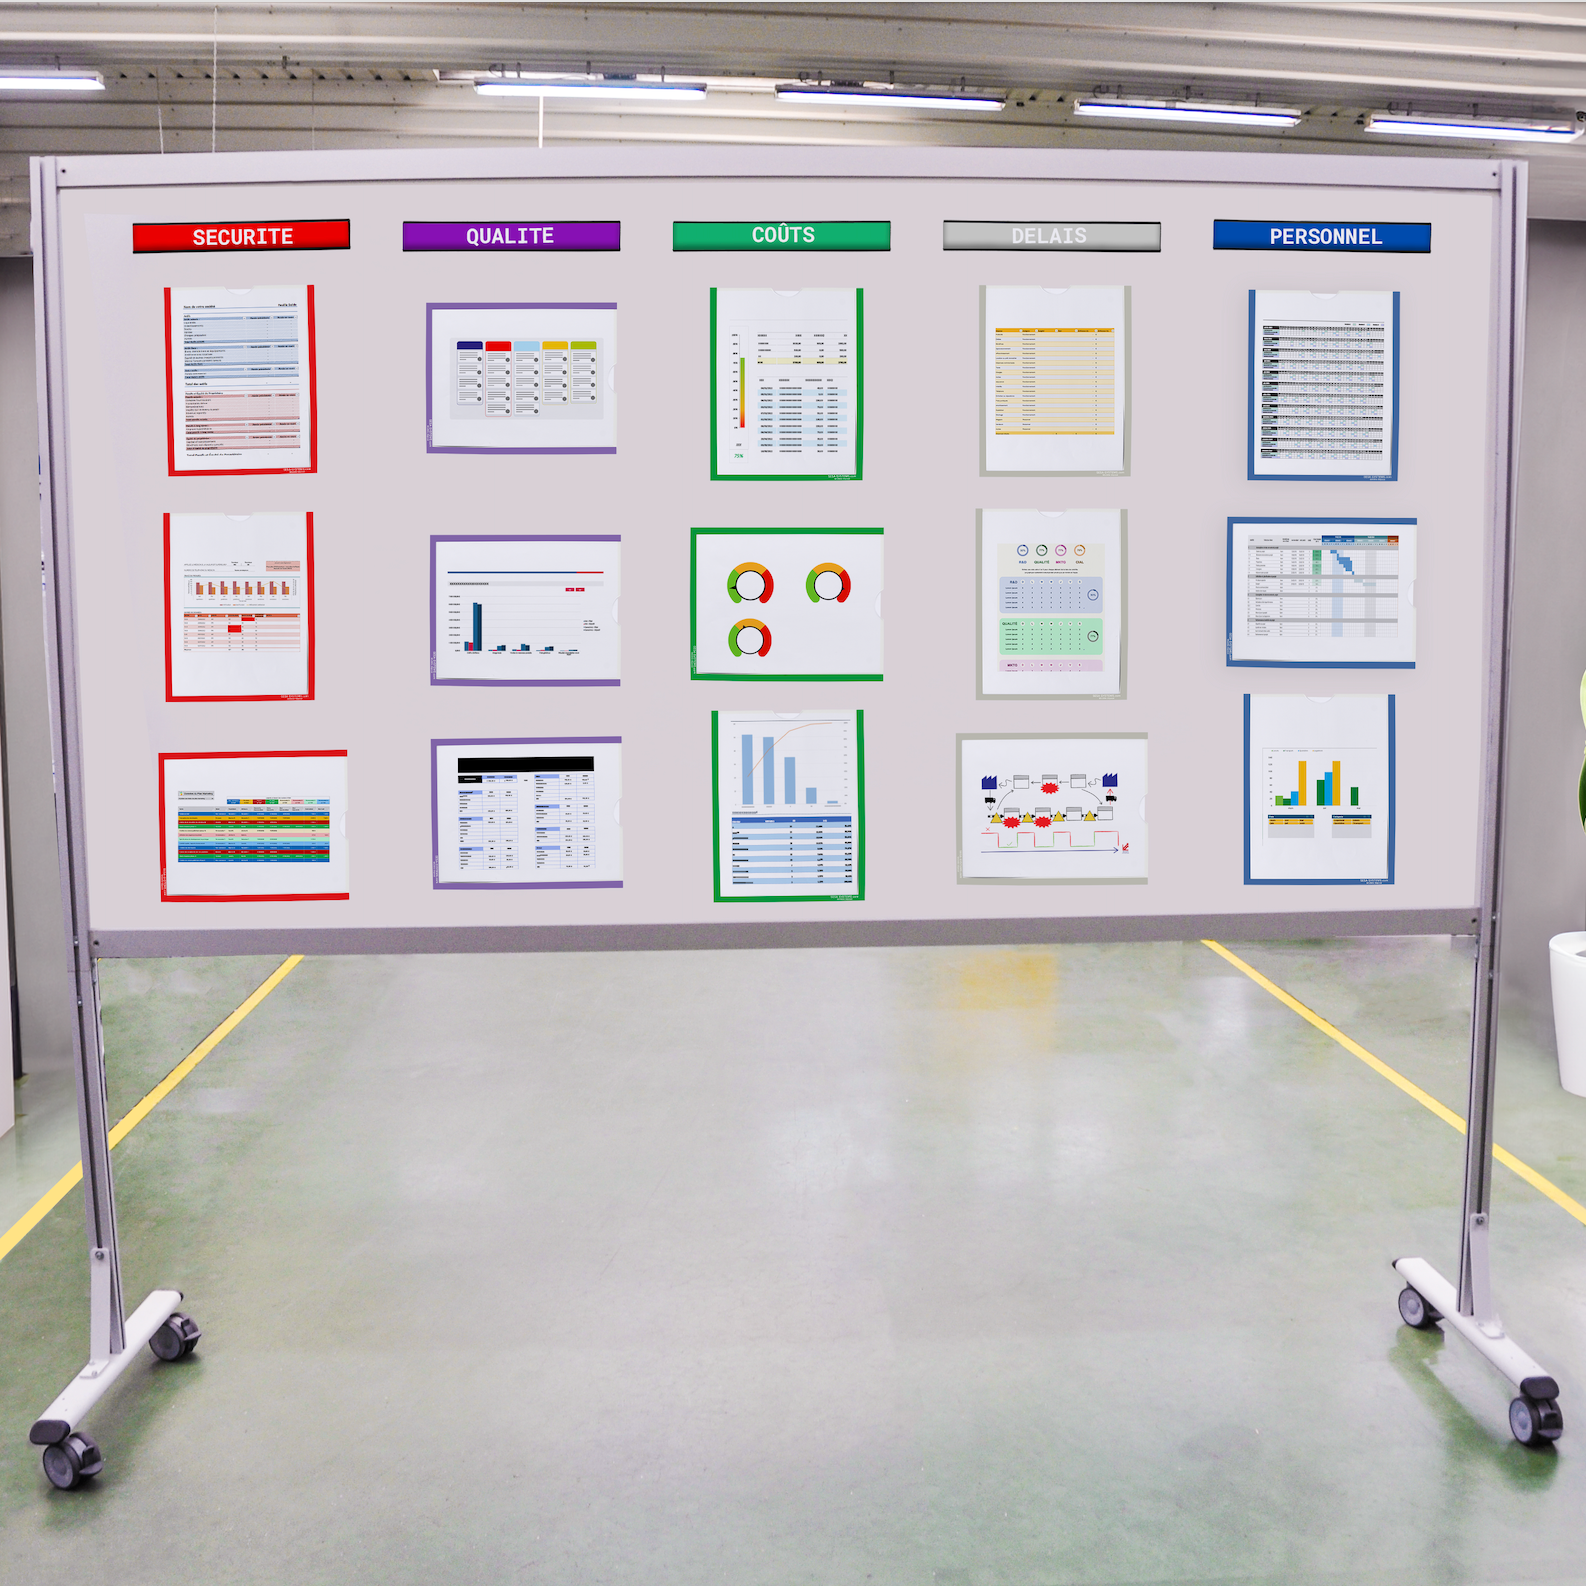
Visual Management is based on simple tools: a board or panel, clear and useful indicators. To ensure effective communication, you need a suitable surface, but you also need to provide visual information. An empty or badly used board does not attract the eye and is quickly forgotten. The table is structured on 3 levels: headings, results and actions, additional information (work sites, flash, ...). The communication support is also divided into sections representing key performance indicators or key information needed by the team on a daily basis (organisation, team life, etc.).
Visual Management is a support for LEAN. This visual expression technique is associated with the 5S method, as well as with the TPM method. But it can also include the Kanban, Six Sigma, PDCA methods. The main goal of this management is to achieve a Visual Factory.
What are the benefits of Visual Management?
- Provides easy access to information and messages understanding.
- Immediately identifies gaps between the ideal situation and the actual situation.
- View processes and risks and identify changes.
- Brings out opportunities for improvement.
- Allows a state of mind of information sharing between teams (transparency)
- Reassures customers and all interested parties.
- Encourages employee involvement.
- Service strategy.
Should we use Visual Management or Digital Visual Management?
Classic" Visual Management displays important information such as indicators, but the updating of information is more or less frequent depending on the company, particularly because of manual entry on sheets of paper that can easily be lost... Digital Visual Management allows information to be updated instantaneously, particularly thanks to connected screens and software that allows information to be forwarded and indicators to be updated in real time.
Why use Digital Visual Management rather than Visual Management?
With the development of technologies, digitalisation is more and more present within companies. As an increasing amount of money is spent on digitalization, several questions can be asked about Digital Visual Management:
- How to structure Visual Management with digital indicators?
- What are the benefits of digital Visual Management?
- How to monitor digital indicators?
- How to update digital indicators in industry?
- How can we move from Visual Management to digital management?
SESA SYSTEMS offers a range of products dedicated to Visual Management with magnetic whiteboards allowing magnetic display with products such as PRODOC or VISIOFLASH which allow the display of the company's key indicators. If an "Industry 4.0" range is also present, it's Digital Visual Management. Several types of products are present, connected screens such as the E-LEANBOARD which allows the display of different indicators throughout the company, the E-MEETING which allows regular analysis of the different indicators displayed within the company or the E-ACTIVBOARD which allows meetings to be conducted with a more in-depth analysis of the different digital indicators. In order to ensure that the information is always up to date, our SESAHUB software allows for the feedback and updating of information in real time.