What is an indicator?
There are several types of indicators, monitoring and performance indicators. To carry out a project, we will set up monitoring indicators. All this concerns the deadlines of an action plan, for example. Performance indicators will be used to measure results during the course of a project. Regardless of the type of indicators, they must meet 5 criteria to be achievable. To check the relevance of the chosen KPIs, we use the SMART tool:
- S --> It must be specific and express a purpose clearly
- M --> It must be measurable and quantifiable
- A --> It must be achievable and have attainable objectives
- R --> It must be realistic
- T --> It must be temporal and therefore limited in time
KPIs allow the company to stick to its objectives, develop and monitor the evolution of a strategy, indicators are necessary for the company's performance. Digitizing the various KPIs in the industry allows real-time monitoring thanks to the feedback of information. This makes it possible to quickly update them and therefore facilitates the transmission of information between managers and different employees.
What is a dashboard?
It is a synthesis tool that makes it possible to manage the progress of a project, it facilitates the analysis and regularly monitors. It also serves as a decision-making tool because it allows the use of appropriate solutions based on the results obtained. As far as indicators are concerned, it is wise to turn instead to a Dashboard that promotes data analysis.
How to build a dashboard?
- Determine goal(s) (SMART objectives)
- Identify objectives and choose the right key indicators
- Organize the steering hierarchy
- Define update frequencies, with digitalization information is recorded in real time
How to make a dashboard effective?
- Share data with all stakeholders
- Use relevant indicators
- Use accurate numbers to facilitate decision-making
- Synthesize data
- Adopt a simple formatting that allows a good observation at a glance thanks to Visual Management.
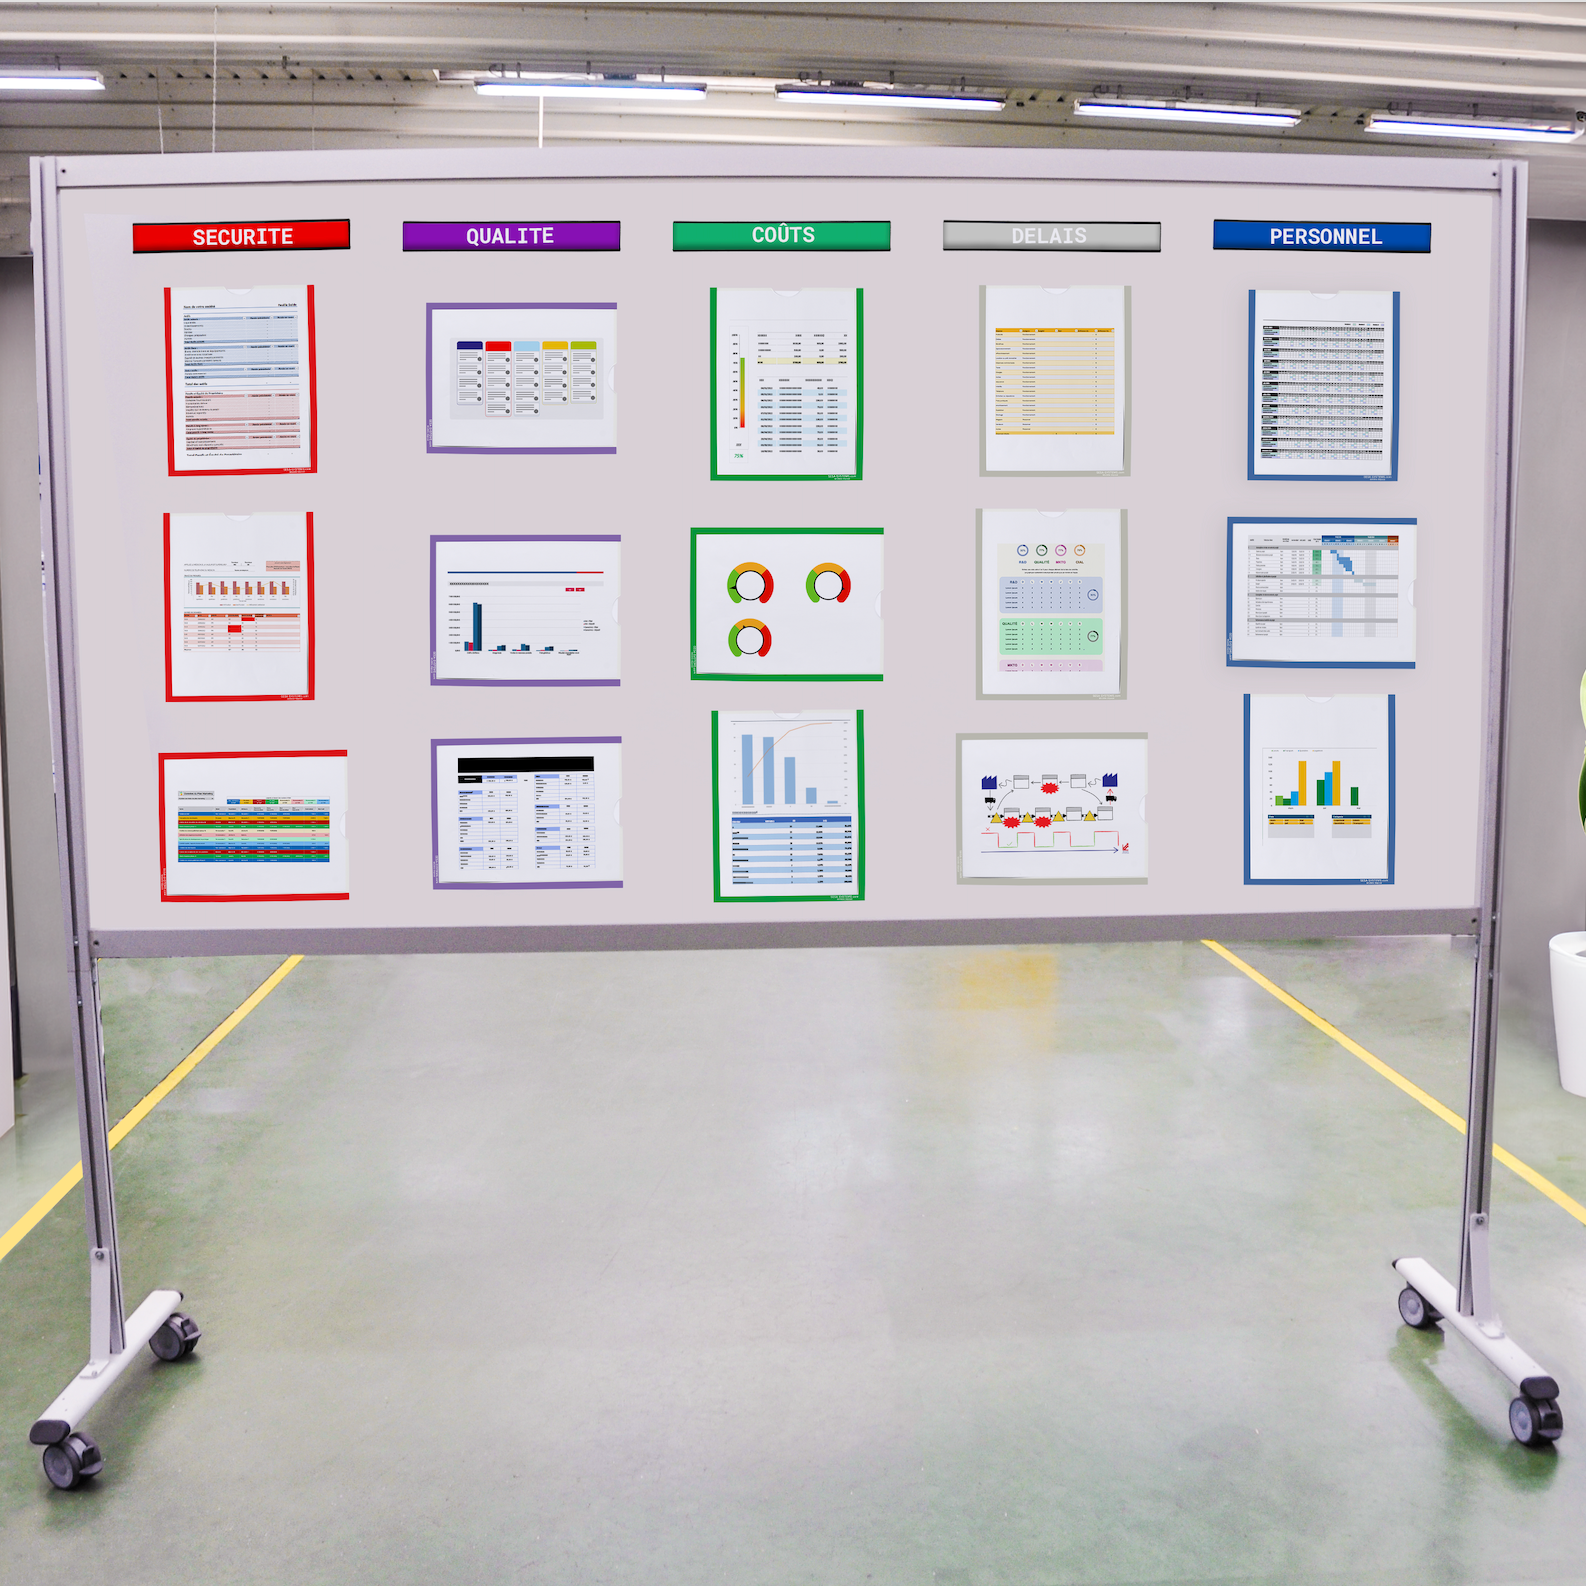
The different stages of information feedback.
- Information entry by operators in real time via the E-STATION tablet
- Daily 5-minute meeting on "E-LEANBOARD"
- Weekly meeting of 15 minutes with all the figures of the week on the "E-MEETING"
- Monthly meeting of 30 minutes with the management on the "E-ACTIVBOARD", this allows to analyze all the figures of the month and the axes of improvement.
How to study the different indicators?
In order to use the results including KPIs (Key Performance Indicator), it is essential to create a dashboard. To analyze the different indicators during meetings, it is wise to have software that allows you to store and report information but also software that analyzes production. In order to use these, it is essential to have connected screens that allow you to carry out a meeting.
With the digitalization of companies new opportunities have emerged, especially with regard to Industry 4.0 with connected screens such as the E-MEETING, the E-ACTIVBOARD which are connected to the same software which is SESAHUB. SESAHUB is the solution to manage your business, this software allows instant and real-time consultation for example of company indicators. Thanks to it, meetings are more easily achievable because everyone can have access to information. Regarding performance indicators at the production level, SESA-MES is the solution to monitor production in real time, this software can be accompanied by an E-LEANBOARD.